A sponsor, client, or auditor asks for the breakdown behind your event’s headline emissions number. You reach the catering and production line, and the honest answer is one combined estimate, not measured data. That number covering event catering and production emissions was never one measurement problem. It is two, and generic tools handle neither well.
Most public guidance on event carbon footprints treats catering and production as a single spreadsheet row. That flattening hides which category is actually driving the total, and it hides that the two need completely different inputs to measure correctly. Attendee travel, hotel stays, production vendors, and materials typically make up 60 to 80% of an event’s total footprint, so getting this section wrong is not a rounding error. It is most of the number.
Why event catering and production emissions get flattened into one line
A combined catering-and-production estimate is easy to produce and hard to defend. It answers “roughly how big was this,” which satisfies nobody asking for audit-ready reporting. It cannot say which supplier, which menu choice, or which piece of rented equipment moved the number, because a blended figure was never built to be decomposed.
The two categories fail differently once you try to separate them. Catering emissions are measurable with the right data, but most tools default to a generic per-meal factor that erases the variation between menus. Production emissions are often not measurable at all in a generic tool, because no standardized factor exists for the equipment and logistics involved. One category needs better data, and the other needs an entirely different measurement approach.
Catering emissions are a supplier and recipe-data problem
More than 90% of a typical food-service operation’s emissions come from purchased goods and services, not the kitchen itself. A catering line that skips supplier and recipe data is skipping most of the actual footprint, not a minor detail.
A single per-meal or per-event-day emissions factor cannot substitute for that level of detail. A recipe-level life-cycle assessment of a croissant found that roughly 70% of its footprint came from the butter alone. Substituting a margarine alternative, with the rest of the recipe unchanged, cut the recipe’s emissions by around 42%. A generic per-meal average would never surface that: two croissants with the same calorie count can carry very different footprints, and the difference lives entirely in supplier and ingredient data a blended estimate discards.
This is not a niche measurement gap. In March 2024, the Science Based Targets initiative removed the net-zero commitments of 239 companies that had missed the deadline to submit targets for validation, and around half of the companies that responded to its campaign survey cited Scope 3 as too much of a challenge to setting net-zero targets. Food and catering supply chains are exactly where that difficulty concentrates.
The scale problem is real even before you reach any measurement software. The Good Eating Company, a UK contract caterer operating 26 sites, measured its Scope 3 emissions by spreadsheet before automating, a process it describes as taking days of staff time every month. Correct catering measurement means recipe- and supplier-level data, sourced and refreshed on an ongoing basis, not a menu-wide average recalculated once a quarter.
Recipe and ingredient data are the largest share of the category, but they are not the only gap. Packaging, from single-use disposables to reusable service ware, and service logistics, how far ingredients travel from supplier to venue, both add a footprint a per-meal factor also flattens away. None of it shows up if the catering line stays one blended estimate.
Production emissions are often not measured at all
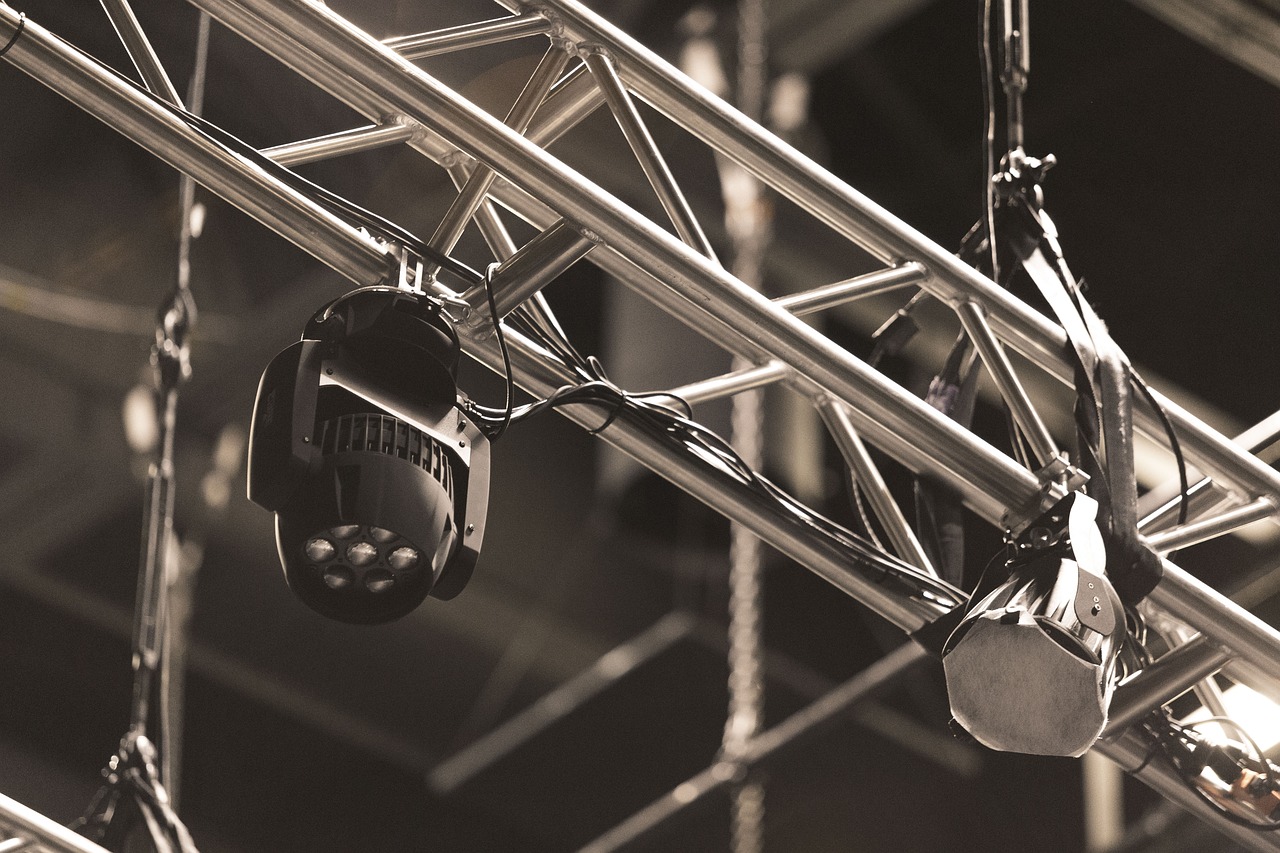
Where catering measurement fails by being too generic, production measurement usually fails for a sharper reason: many generic carbon tools have no standardized emissions factor for event production at all. AV equipment, staging, and temporary power draw are treated as a footnote, covered by a manual estimate if they are covered at all.
That gap matters because the swings inside production are large. LED stage lighting uses roughly 75% less energy than incandescent, LED video walls draw around 60% less power than older plasma displays, and Energy Star-certified gear can cut energy use by up to 50% against legacy equipment. A rough estimate that treats “AV” as one number cannot capture a difference that size, and it will not tell you which equipment choice actually earned the reduction.
Two specific gaps make production measurement even easier to get wrong. Standby power, sometimes called vampire load, is the electricity AV equipment draws in standby mode between sessions or overnight, and it adds up across a large installation while rarely appearing in a manual estimate. Separately, if your organization does not own the venue, the electricity your AV setup draws is usually a Scope 3 emission, not Scope 2, a classification mistake common enough that it shows up repeatedly in event reporting guidance.
Metered data closes both gaps at once. A supplier-provided, metered kilowatt-hour reading after an event is measurably more defensible than an estimate applied after the fact, and it already reflects standby draw and actual venue conditions rather than a nameplate power rating. Asking an AV supplier for that reading, rather than assuming one, is the difference between production data and a production guess.
Whether equipment is rented or bought changes the measurement too. Renting spreads the embodied carbon of manufacturing that equipment across many events and users, lowering the effective footprint attributable to any one event. Production Resource Group redesigned its touring structures to reduce the weight and volume of equipment moved between venues, and reports roughly 50% fewer direct transport emissions as a result, visible only because production was measured at the equipment and logistics level.
The same pattern shows up at larger scale. Salesforce tracks its Dreamforce conference’s travel, waste, and water emissions in near-real time through its own reporting platform, rather than compiling them after the event ends. Neither that visibility nor PRG’s transport reduction was available from a single blended production estimate. Both came from measuring production as its own category, with its own data.
What defensible measurement looks like for both
Catering and production fail for opposite reasons, but the fix has the same shape: measured, supplier- or vendor-sourced data, broken out by category, not a modeled average folded into one number. A stakeholder, sponsor, or auditor reviewing your footprint should be able to see what catering contributed and what production contributed separately, and trace each back to a real source.
This is the same reason event carbon measurement needs to be purpose-built for events rather than adapted from generic corporate carbon accounting tools. Recognized methodologies and continuously updated emissions factors, applied specifically to categories like catering and production, produce a number that holds up under Scope 1, 2, and 3 review rather than one that only looks precise until someone asks where it came from.
In practice, that means a structured intake for each category rather than one combined form: caterers and production vendors supply their own data, on their own schedule, before an event closes its books, not reconstructed from memory afterwards. EventZero is built around that structure, automating measurement across the full event footprint, including catering and production specifically, so the categories arrive already broken out.
Measuring catering and production emissions correctly
A combined catering-and-production line was never going to survive close review, because it was built to answer “roughly how much,” not “measured how.” Catering needs recipe- and supplier-level data. Production needs measurement infrastructure where generic tools currently have none. Treating them as one number only postpones the moment someone asks you to break it down.
If your next event report needs to survive that question, book a carbon strategy session and work through what measured catering and production data would actually look like for your events.